Financial Vital Signs: Why Your Place of Worship Needs a Check-Up

56% of faith leaders feel confident in their financial preparedness to handle unforeseen circumstances, according to the latest Giving in Faith report.
Where does your organization stand?
Much like our physical health, your place of worship’s financial health requires regular check-ups. These check-ups are crucial for keeping a pulse on your church’s financial wellbeing.
Evaluating your church’s giving is a key part of this process, helping diagnose potential issues and allowing for necessary adjustments. By keeping a close eye on your giving, you can ensure the long-term financial strength and resilience of your organization.
In this blog post, we’ll explore three essential vital signs to evaluate your church’s giving.
3 vital signs to assess your church’s giving health
To get a clear pulse on your church’s giving, it’s essential to examine three key metrics:
- Year-over-year donations
- Quarter-over-quarter donations
- Year-to-date donations compared to your expected goals
These indicators provide valuable insights into your giving health and can help guide your future strategy. Let’s dive into how you can assess these vital signs.
1. Year-over-year donations
Analyzing year-over-year (YoY) church donations allows you to track how giving patterns have changed from one year to the next. This comparison helps you understand trends and identify factors that may have impacted your giving.
How it can help:
- Long-term perspective: Provides insight into the overall financial health of your place of worship and your giving growth or decline over time.
- Effective planning: Helps you make informed decisions and plan for the future based on past performance.
Here’s how to do it:
- Obtain your total church donations for the current year
- Obtain your total church donations for the previous year
- Calculate the percentage change in donations:
- Subtract last year’s total from this year’s total
- Divide the result by last year’s total
- Multiply by 100 to get the YoY percentage change
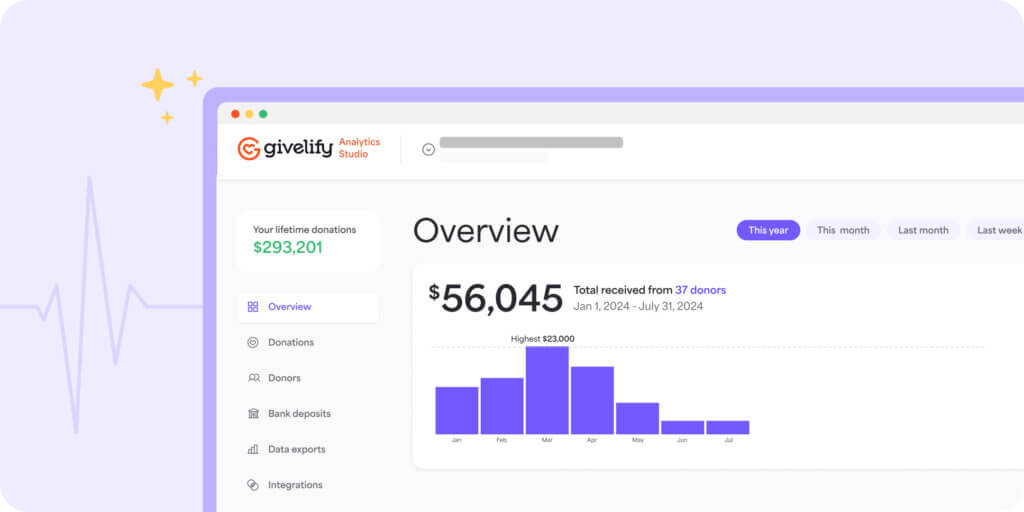
Tip: Learn how to use Givelify Analytics Studio to easily access yearly donations with just a few clicks. Not using Givelify? Get started for free today.
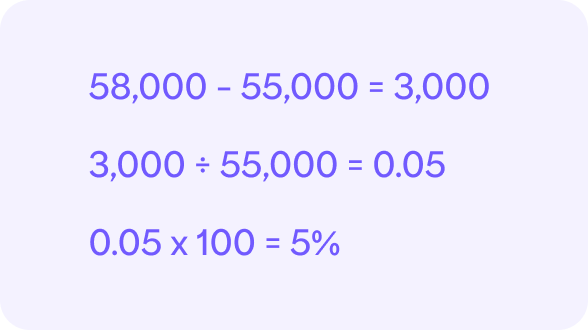
Use this formula to calculate the percentage change in YoY donations:

For instance, if last year’s total was $55,000 and this year’s total is $58,000, here’s how you would calculate the year-over-year percentage change in donations:

Need help with these calculations? Reach out to our award-winning support team for assistance.
What this tells you:
A positive percentage change indicates an increase in giving from one year to the next, while a negative percentage change indicates a decline.
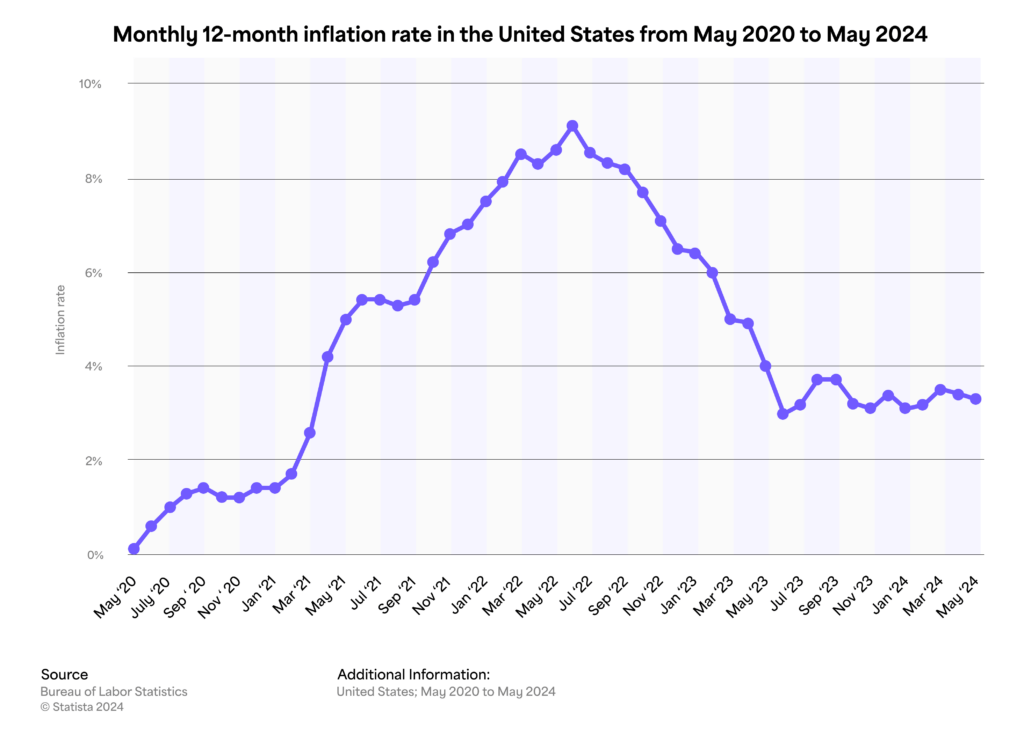
While growth in giving is good, it’s important to ensure this growth exceeds the annual inflation rate. The inflation rate measures how much prices for goods and services increase over time.
For example, if the inflation rate is 2%, goods or services that cost $100 a year ago now cost $102. In this case, a YoY percentage change of 2% would mean your giving has remained steady since it equals the rate of inflation. While a percentage change above 2% would indicate growth.
Since inflation rates vary from year to year, check the current inflation rate to determine if your church’s giving is growing faster than inflation.

Whether positive or negative, investigate potential causes behind these trends, such as changes in giving patterns, external events, or internal church activities that may have impacted giving.
Understanding these factors will help you adjust your strategy and maintain the financial health of your organization.

2. Quarter-over-quarter donations
Analyzing quarter-over-quarter (QoQ) church donations helps you track short-term giving trends and identify seasonal variations. This approach provides insights into how donations fluctuate throughout the year, reflecting changes in your church’s activities or external factors.
How it can help:
- Short-term trends: Helps you understand short-term fluctuations in donations and manage cash flow more effectively.
- Anticipate changes: Allows you to anticipate periods of higher or lower donations, aiding in more accurate financial planning.
Here’s how to do it:
- Collect quarterly church donation data for the following date ranges:
- Q1 (January 1-March 31)
- Q2 (April 1-June 30)
- Q3 (July 1-September 30)
- Q4 (October 1-December 31)
2. Calculate the percentage change
Compare Q2 to Q1:
- Subtract the Q1 total from the Q2 total
- Divide that result by the Q1 total
- Multiply by 100 to get the QoQ percentage change
Tip: Learn how you can use Givelify Analytics Studio to easily access quarterly donations with just a few clicks. Not using Givelify? Get started for free today.
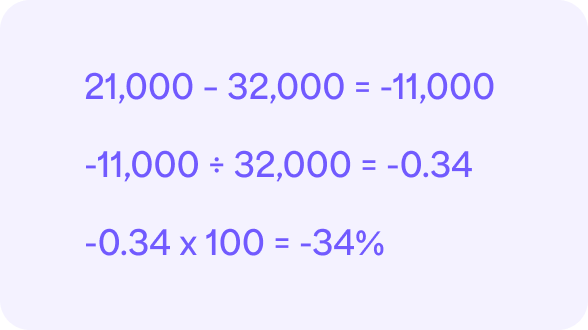
Use this formula to calculate the quarterly percentage change in donations:

For instance, if Q1’s total was $32,000 and Q2’s total is $21,000, here’s how you would calculate the quarter-over-quarter percentage change in donations:

Repeat for subsequent quarters:
- Use the same method to calculate changes between Q3 and Q2, and Q4 and Q3
Need help with these calculations? Reach out to our award-winning support team for assistance.
What this tells you:
A positive percentage change indicates an increase in giving from one quarter to the next, while a negative percentage change indicates a decline.
It’s normal for this number to fluctuate between positive and negative due to the seasonality of giving. For instance, if a major giving day like Easter falls in Q1, you might see a negative percentage change when comparing Q2 to Q1.
This metric can also show the impact of your programs on giving. If you implemented certain initiatives in a quarter, you can see if these efforts positively influenced donations.
Understanding these patterns can help you adjust your church budget and fundraising strategies, allowing you to anticipate fluctuations and better manage financial resources throughout the year.

3. Year-to-date donations compared to budget
Analyzing year-to-date (YTD) donations compared to your budgeted expectations is crucial for tracking how actual donations align with your financial goals. This comparison helps you gauge whether you are ahead, on track, or behind your budgeted targets for the year.
How it can help:
- Informed decision-making: Knowing whether you’re ahead, on track, or behind your church budget allows you to make informed decisions about spending, saving, and fundraising efforts.
- Financial management: Helps you adjust strategies to ensure financial stability and meet your goals.
Here’s how to do it:
- Review year-to-date church donation totals
- Compare to budgeted targets
- Obtain your budgeted targets for the same period
- Compare these targets to your actual year-to-date donations total
Tip: Learn how you can use Givelify Analytics Studio to easily access year-to-date donations with just a few clicks. Not using Givelify? Get started for free today.
What this tells you:
This comparison is one of the best ways to assess your giving. By comparing the total donations raised so far with your budgeted goals, you can determine whether you are on track, falling behind, or exceeding your annual targets.
If you’re falling behind, you may need to adjust your budget or revise your fundraising strategies to get back on track. If you’re on track or exceeding your goals, identify what’s working and continue implementing those strategies.
Monitor your progress regularly to ensure your giving remains aligned with your objectives, allowing you to make any necessary adjustments.

Maximize your church’s financial health: Next steps and expert insights
Regular financial check-ups offer a clear picture of your church’s financial health. By closely monitoring these three vital signs, you gain valuable insights into your organization’s financial wellbeing.
With a better understanding of where you stand, you’ll be well-prepared to navigate challenges, make informed adjustments, and support the continued growth and success of your place of worship.
Not sure where to go from here? Hear directly from our generosity experts on what steps you can take next — whether your giving is on track or needs a boost — to ensure you meet your annual giving goals.


